Analytics (Premium)
This guide shows you how to access and interpret the Analytics section on Vendor Portal. Analytics is a Premium feature with interactive graphs and key stats for page visits, reviews, time on page, CTA clicks, and website referrals—all in one place so you can track how each update affects your profile and boost its performance. To open the Analytics dashboard, simply click the Analytics option in the left sidebar.
Analytics is a Premium feature. To unlock these insights, click Upgrade to Premium on the Analytics page.
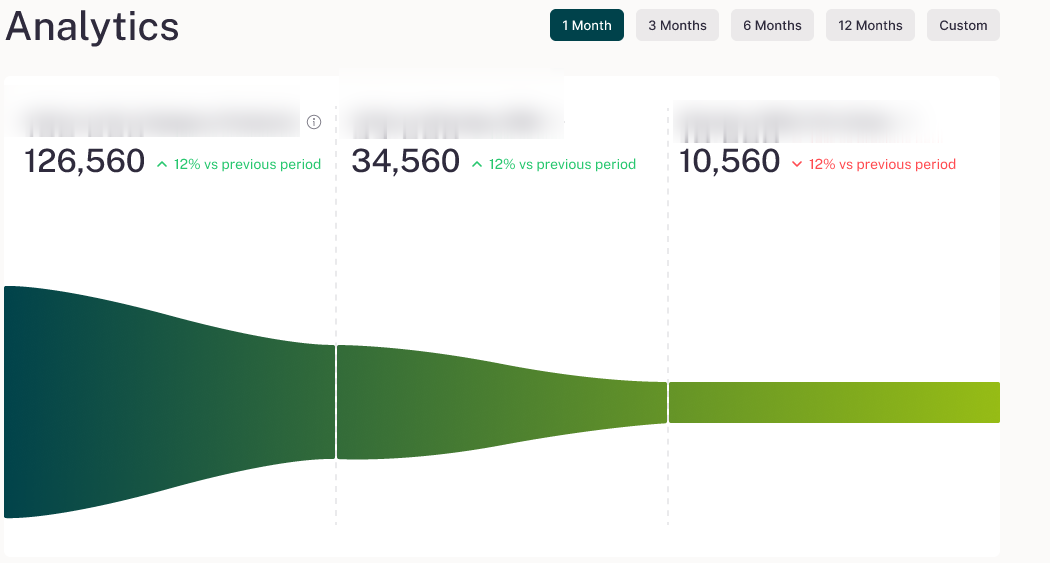
Conversion Funnel
At the top you’ll find a horizontal funnel chart that visualizes three stages of user flow side by side:
-
Visits to this Category Products
Total pageviews across every profile in your category. -
Impressions
How many times your profile appeared in listings or search results. -
Your Product CTA Clicks (CTA setup required)
The number of users who clicked your call-to-action across the website — this metric only shows up after you configure a CTA on your profile.
CTA-related graphs will only populate once you’ve set up a CTA button on your profile.
Each stage displays its value and a colored percentage showing change versus the previous period, making it easy to spot drop-off points and track improvements over time.
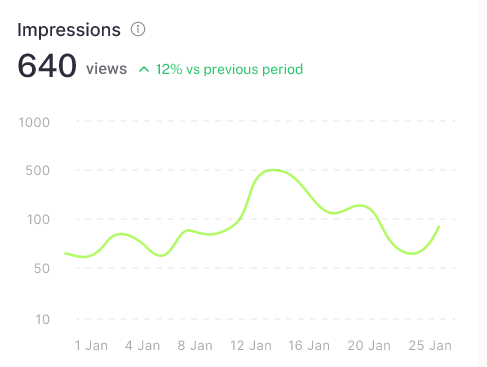
Impressions
A sparkline chart that shows how many times your profile appeared in listings or search results during the selected period.
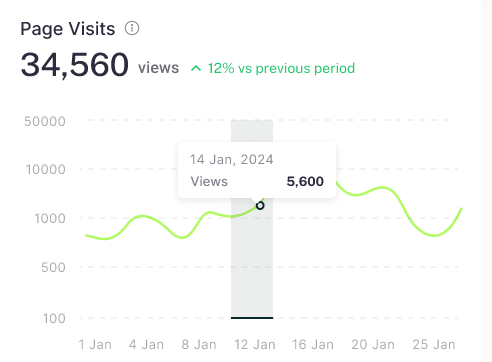
Page Visits
A sparkline line chart that plots daily pageviews across all pages of your profile. Above it you’ll see the total views for your selected period and a % change versus the previous period. Hover over any point to view the exact count for that day.
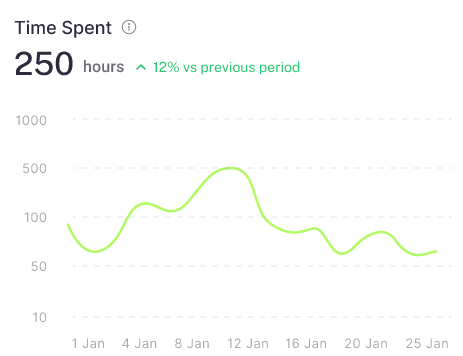
Time Spent
This sparkline chart plots the total hours visitors spent across all pages of your profile each day. Above the chart, you’ll see the total time (in hours) for your selected period and a % change versus the previous period. Hover over any point to view the exact hours recorded on that date.
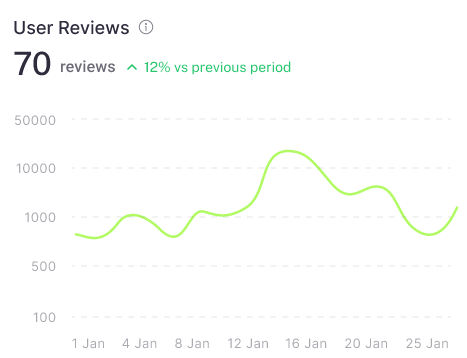
User Reviews
A sparkline line chart plotting daily counts of new reviews submitted for your profile. Above the chart you’ll see the total reviews for the selected period and a % change versus the previous period. Hover over any point to view the exact number of reviews on that day.
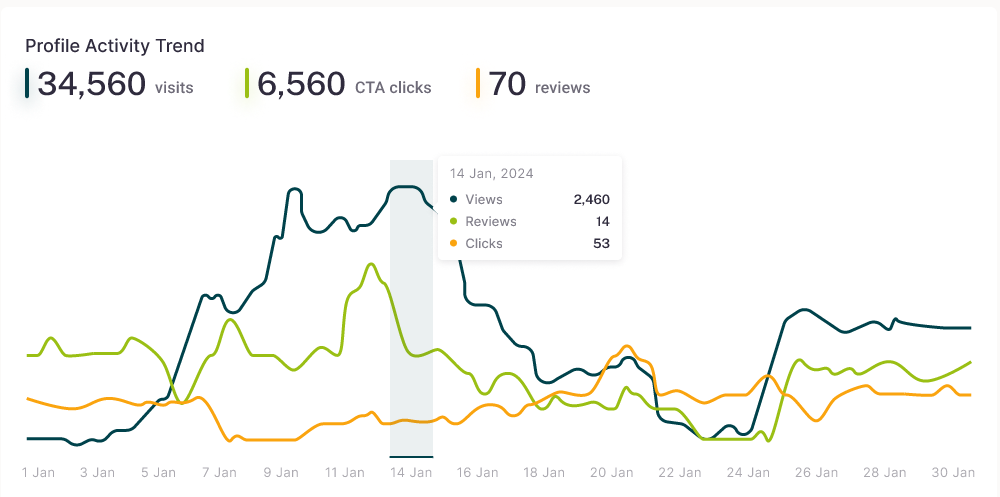
Profile Activity Trend
At the bottom you’ll find a multi-line chart that brings together your core engagement metrics in one view, helping you spot how they move in relation to each other over time.
- Views: Daily pageviews of your profile
- CTA Clicks:(CTA setup required): Daily counts of CTA button click
- Impressions: Profile appeared in listings or search results.
Above the chart, total counts for each metric display your overall performance for the selected period. Hover over any point to see the exact values for that date or click-and-drag to zoom in on a specific timeframe.
FAQs
How do I change the date range?
Click the date selector at the top-right of the Analytics page and choose one of the presets (7 days, 30 days, 6 months) or set a custom range.
What does the Setup CTA Button do?
Once you configure and publish a CTA button on your profile, the CTA Clicks metric in the Conversion Funnel and related charts will populate with data. Without a set-up CTA, those sections remain unpopulated.
Who can access Analytics?
All users see the Analytics tab, but only Premium subscribers can view the data. Free users will be prompted to upgrade when they click it.